Monitoring your portfolio
After the hard work of establishing your investment goals, deciding your asset allocation and selecting your managed fund, comes the fun part: seeing how your individual investment decisions play out over time.
- Your investment portfolio should stay in line with your investment objectives.
- There are four aspects to monitoring your portfolio: performance, fees, asset allocation and goals.
- Staying on top of your portfolio enables you to change its structure as your needs change.
Monitoring your portfolio through time is an important part of investing. When done properly, it helps you make adjustments as needed and it helps you stay on track to meet your investment goals.
There are four aspects to monitoring your portfolio:
- Performance
- Fees
- Asset allocation
- Goals
The monitoring should be done using a spreadsheet or software you can access online through tools provided by your administration platform (if you have one). There are a number of free templates that will help you set this up, so you won't need to design these from scratch. Nevertheless, you should find the system that works best for you. Ideally the systems you use should have automatic links to your investments, but this will not always be the case. But as useful as having data in one place is, investors actually have to put it to good use to extract value from it.
Performance
The first and perhaps most obvious data point to track is a portfolio's performance. For this you need to track the performance of each individually held investment. These might be individual securities (shares, for example), or managed funds (unit trusts, ETFs, LICs).
Performance is generally provided to a recent point in time. For example, it might be over one month, six months, one year, three years or more. This is then compared with a relevant benchmark index. The index represents the asset class you are invested in (for example, Australian equities or fixed income). There are a lot of technical measures that can be generated by your software and these help give insight into the risks your portfolio is taking relative to the broader market.
One of the keys to performance monitoring is not to worry too much about a few underperforming investments. Remember that not all investments will outperform all the time. It might well be that the investments that are underperforming now will perform at different stages of the investment cycle, just as those that are currently outperforming will go through periods - sometimes for many years - when they will underperform.
The next step is to group together assets that are alike (by this we mean all investments in a specific asset class). The size of each investment is taken into account to produce a total overall asset class return. You will find that putting investments together from the same asset class will produce a return that is much closer to the asset class index than the returns from your individual securities or managed funds. This is diversification at work.
You should compare your total overall portfolio return against your investment objectives, returns target and whether you beat inflation by the amount you anticipated.
Fees
The second key item to track is the fees you are paying. All fees reduce the value of your portfolio, but expensive investment products, over time, can reduce a portfolio by tens if not hundreds of thousands of dollars.
The chart on the previous page shows the effect of different fee levels on a portfolio consisting of 30% Australian shares equities, 30% international equities and 40% bonds. The fund that pays 0.25% pa in fees has a final value of around $37,000. The portfolio with fees of 1%pa (which is not unrealistic) has a final value of around $24,000 - around 35% less.
The chart below makes the example more realistic by introducing net positive cash flows of $10,000 a year. This makes it similar to a superannuation portfolio being built over 20 years that receives
regular contributions. As a result you will note that the difference fees make in absolute terms is much greater. This is expected since the contributions to the portfolio make up a substantial part of the return (at $10,000 a year this equates to total contributions of $200,000 over 20 years). The portfolio with 0.25%pa fees ended up with a total value of $504,000 while the portfolio paying 1%pa fees had an ending value of $382,000. That's a difference of $120,000. For the average retiree that equates to around two years of living expenses.
Asset allocation
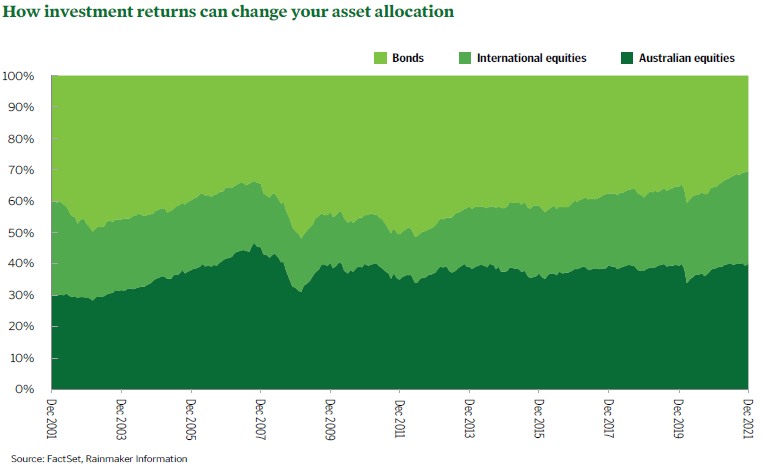
The third critical piece of information you need is the overall asset allocation of your portfolio. While you may have invested based on a perfect plan, your asset allocation will change as markets send some investments up and others down.
The chart below shows how asset allocation changes purely based on the relative returns of each asset class. Part of the job of monitoring your portfolio is ensuring that asset classes don't drift too far away from our intended asset allocation. After all, the asset allocation was designed to meet certain investment goals. That's a much harder job when they are out of balance.
Allowing asset classes to drift can cost you in terms of performance. The ideal is to use cashflows (whether adding to or redeeming assets) to maintain an asset allocation within your chosen limits.
Goals
Last but not least, it's important to evaluate a portfolio in light of our financial goals. While keeping an eye on performance, fees and asset allocation is important, it's pointless if we aren't on track to meet our goals for investing in the first place.
Some investment tracking tools also come with tools to track financial goals. For many, the goal will be retirement. For others, it might be to generate an income stream to fund a comfortable lifestyle (regular overseas travel, home renovation, purchasing a boat and so on).
| How do I choose the best managed fund? |